In the process management section, risk scores are assigned to the data files based on the number of test hits and risk entities like vendor, customer, and employee. You may modify the test models and execute them again. The modifications could be done one of four ways.
By enabling or disabling the tests.
By adding weights to the tests to increase the risk score of the hits and the risk entities.
By adding parameters to the tests to reduce the false positives scenarios.
Processing is the first segment under Process Management.
Model Execution
By default, model execution option is shown as selected, and the corresponding values are displayed on the grid. Here you can access the list of modules with summary of analytics and model execution status displayed on the grid.
Tick the check box of the modules whose status is either in Pending or Not Initiated or Failed and then click on the Model Execution button to initiate the process. You may click on the refresh button to monitor the status of model execution.
Below are the descriptions of the fields displayed on the grid.
Module: List of modules, for which data is mapped successfully.
Total Tests: Count of non-text analytics of the modules present in the library.
Total Executed: Count of non-text analytics executed based on the data availability in the underlying database tables.
Test Hits: Count of non-text analytics which have hits out of all the non-text analytics.
Status: It represents the status of the model execution, for Failed records, you could click on the information icon to know the reason for failure.
.png)
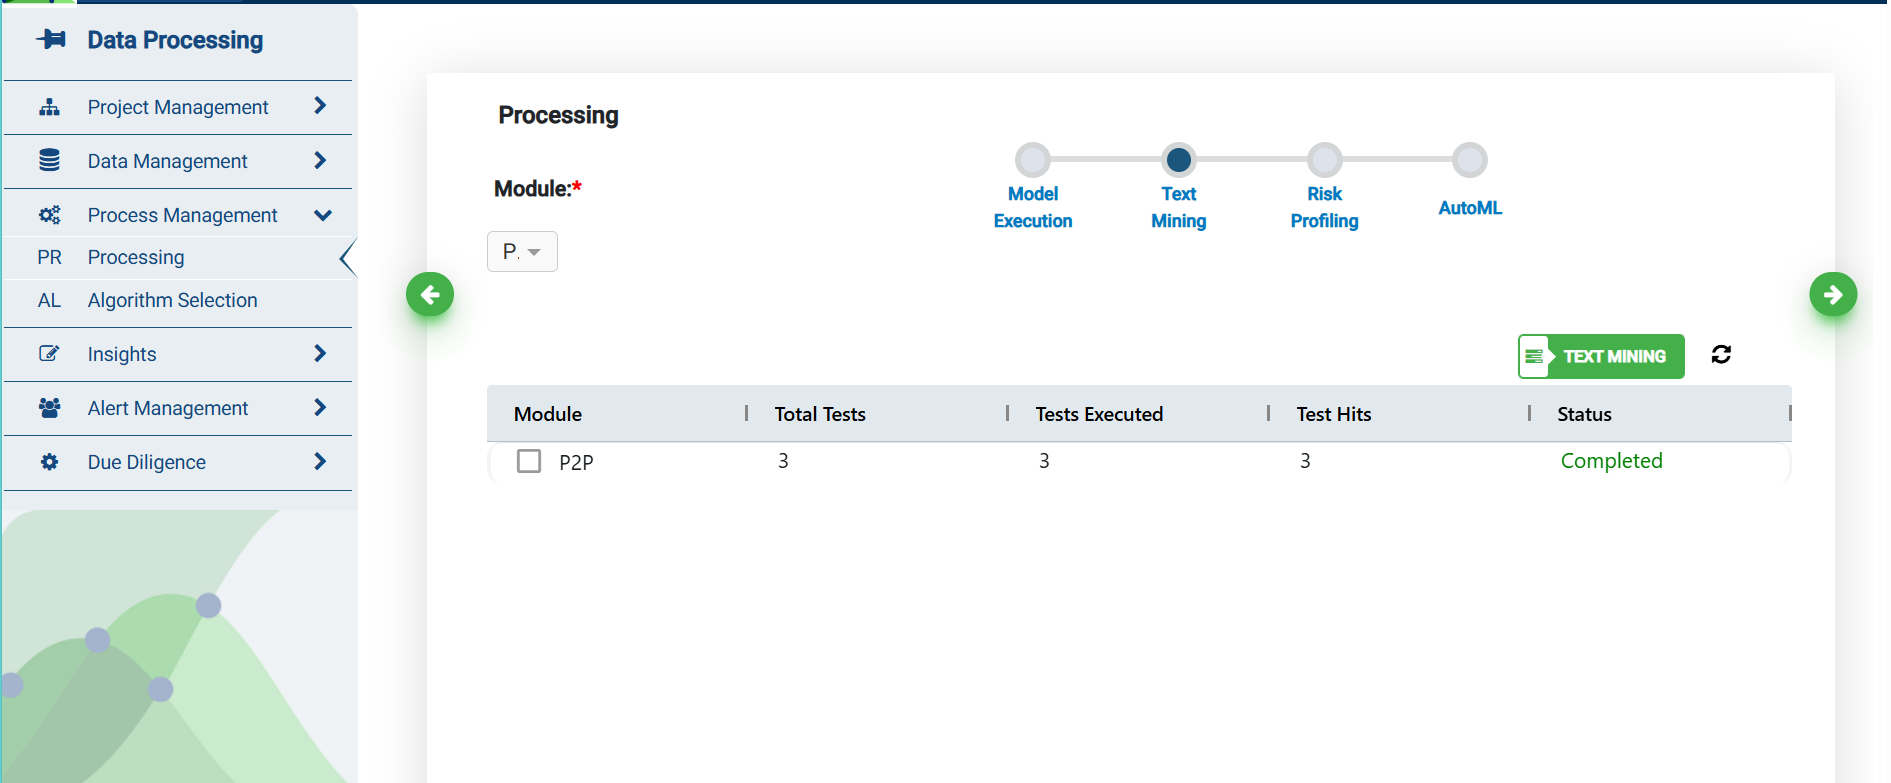
Text Mining
Under Model Execution, tests are performed to gather non-text analytics. Under Text Mining section, a list of tests is performed on free text fields mapped to the database tables.
Tick the check box for module selection, whose status is either in Pending or Not Initiated or Failed and then click on the Text Mining button to execute the tests.
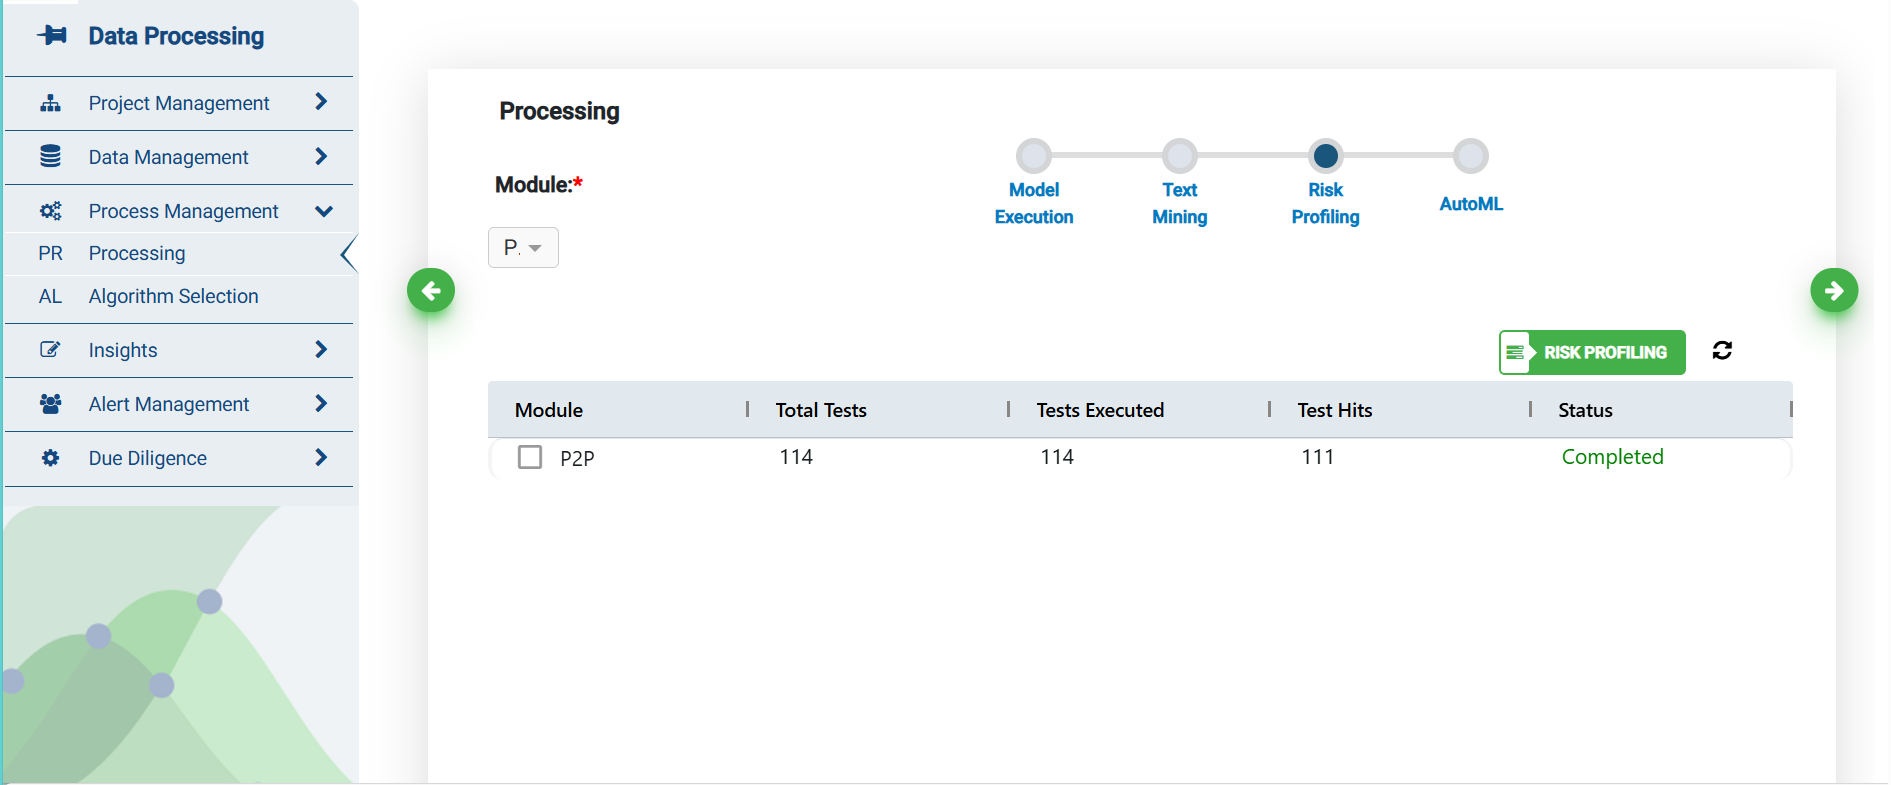
Risk Profiling
All the tests’ hits on non-text fields and free-text fields are combined and then a corresponding risk scores are assigned to these problem transactions based on three risk entities like vendor, customer and employee in this section.
You may refresh the screen using the refresh button. The files go through the same set of status i.e., In Queue, In Progress, Failed or Completed. For failed records, you could click on the information icon to know the reason for failure.
Auto ML
The Automated Machine Learning feature of the konaAI application is part of the data preparation pipeline and is designed to give better insights with each new data set that the model trains on. The predictions triggered in this section are based on the current active model selected in the Insights section.
.png)
Refer to ML View to understand the different model options available in the konaAI application and how to select the appropriate model for your data set.
The Auto ML feature in Processing can be utilized after the risk scoring process is completed in the application. Any predictions triggered here is automatically reflected in the Transaction View screen.
To view the results in the Transactions window, filter the column to “ML_Prediction” and “ML_Risk” Score and see the updates on the initiated Auto ML processing.