All the tests that are executed so far under the processing section are in-built, but what if you want to add a condition or two for these tests or change the input parameters and analyze the results? You may use one of the following actions.
Enable or disable the tests.
Add weights to the tests to increase the risk score of the hits and the risk entities.
Add parameters to the tests to reduce the false positives.
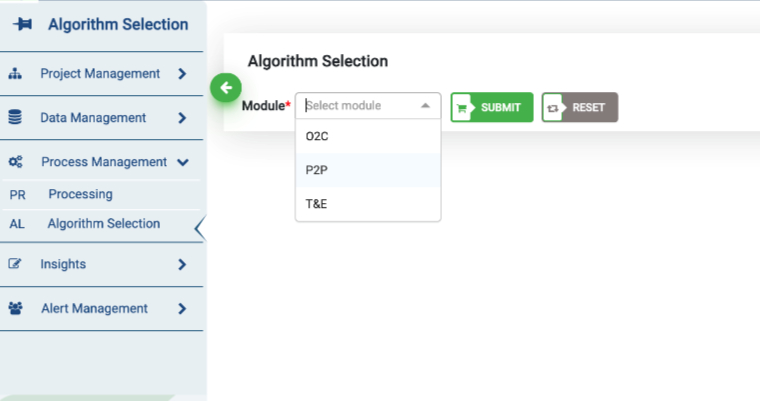
Module Selection for Analysis
Select the desired module from the drop-down list.
Select the sub-module
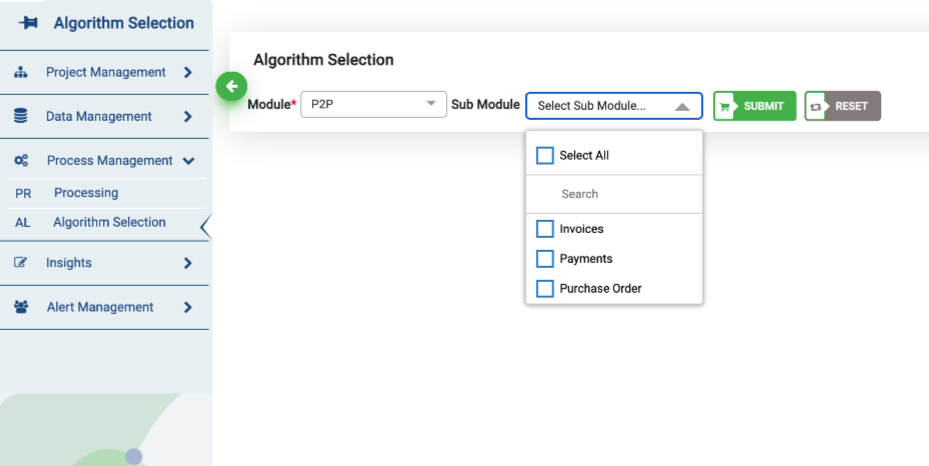
Select the risk category and click the submit button
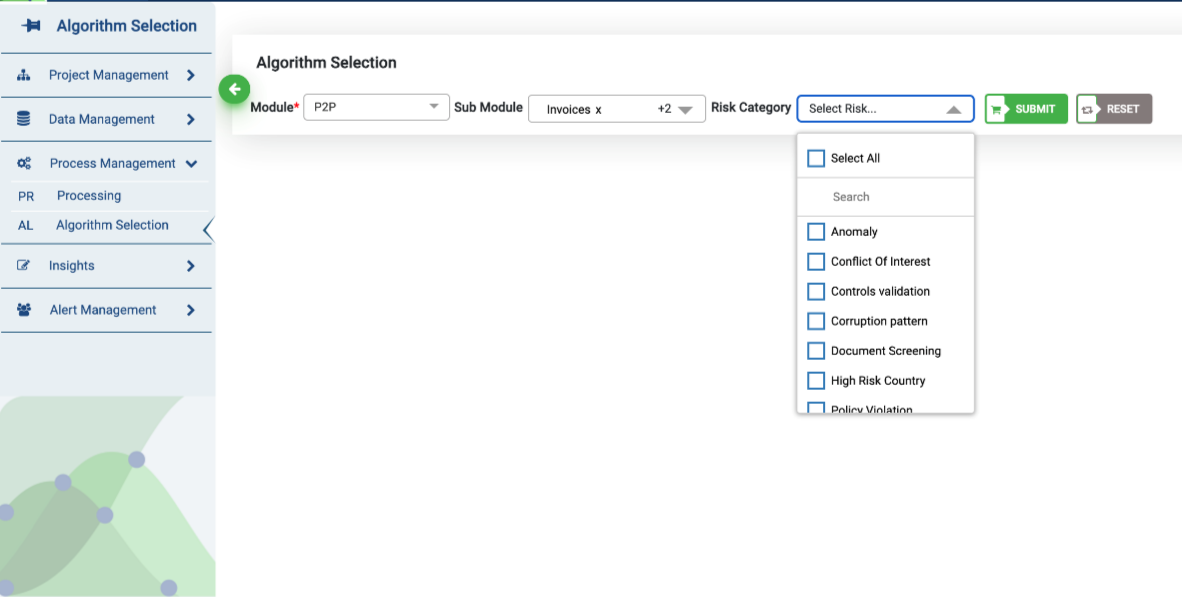
Note: Use the reset button to revert to the default setting or undo your previous selections.
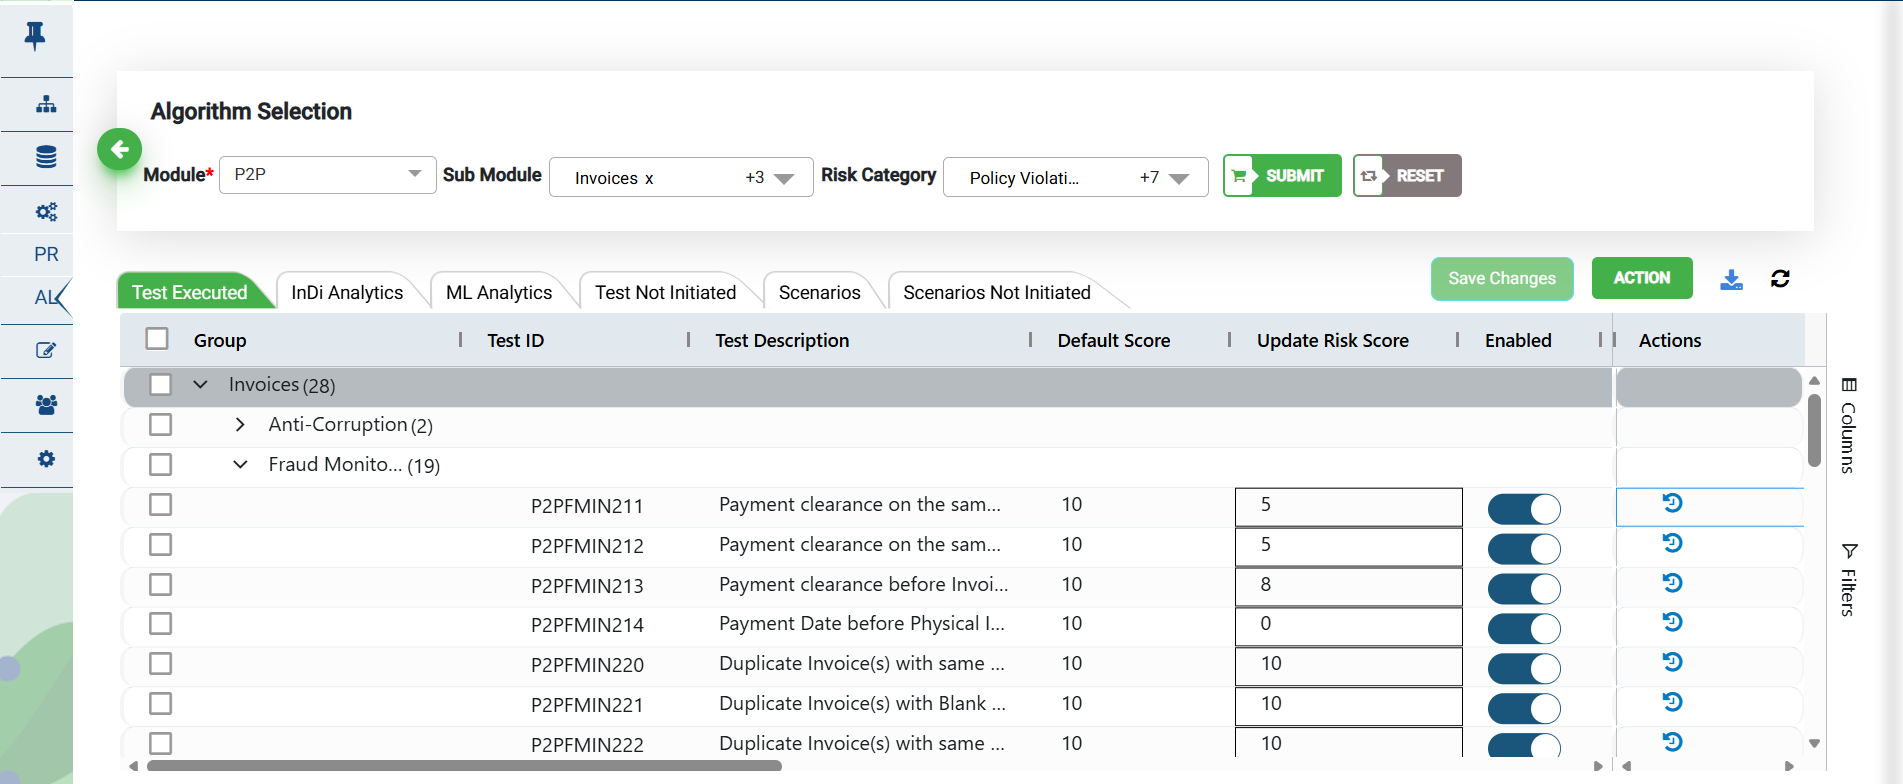
Test Execution
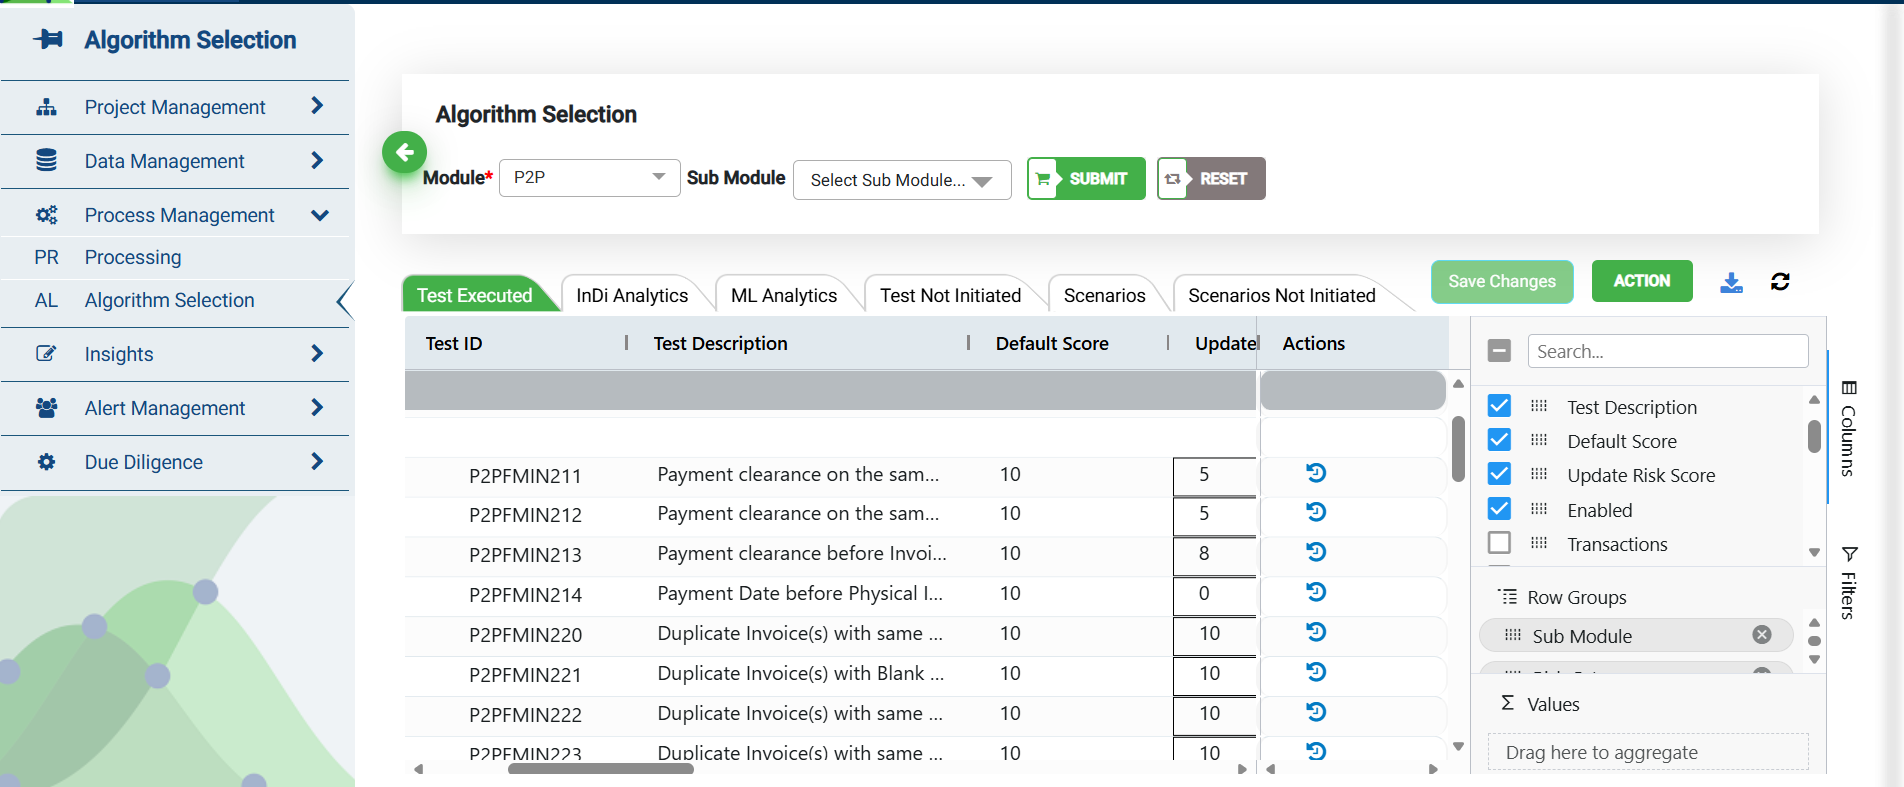
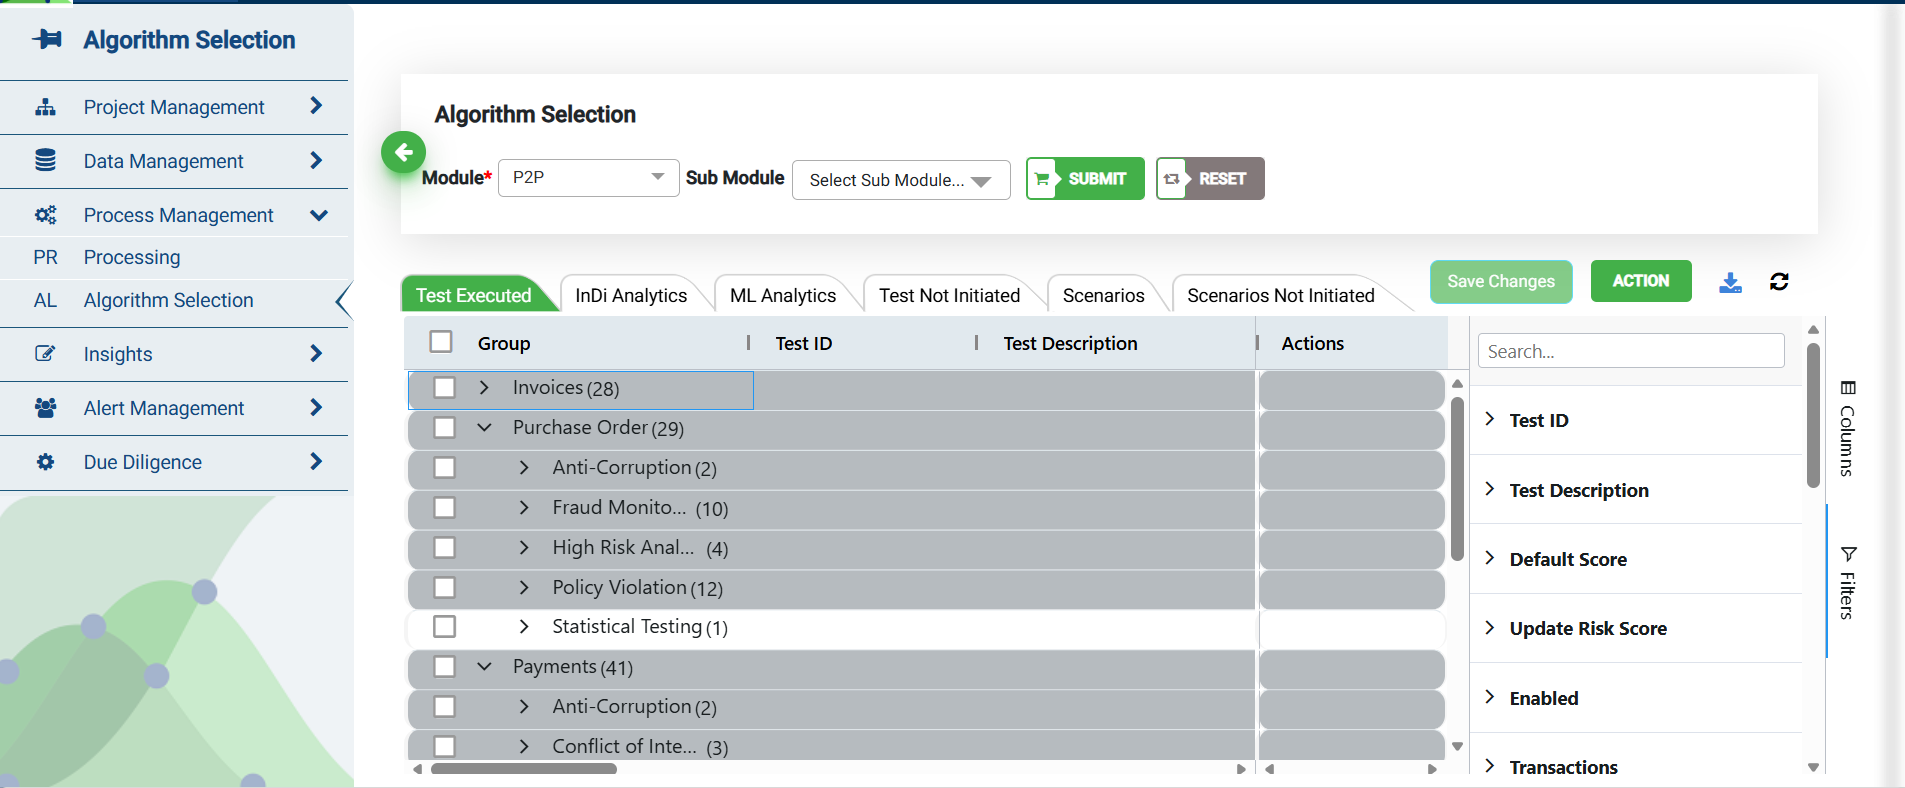
By default, analytics are grouped by sub module and risk category on the grid. To remove the grouping:
Click on Columns
Remove the fields under Row Groups
Columns in the grid can be added or removed by selecting/unselecting the check box
Alternatively, users can utilize the checkbox to run tests on specific groups or categories. Users can also modify the risk score on specific line items when executing a test. The legend displayed shows which risk scores have been modified.
Note: An email is triggered each time a test is executed and/or completed by a user.
Work Area Field Descriptors
You may view all the work area field descriptors by selecting the "Filters" option on the right-hand side of the grid, located under the "Columns" option.
Test ID: List of Test IDs executed on the module.
Test Description: Description of Test IDs executed on the module.
Sub Module: Sub module on which the test has been executed.
Risk Category: Risk category of the test.
Default Score: Default weightage applied on the test.
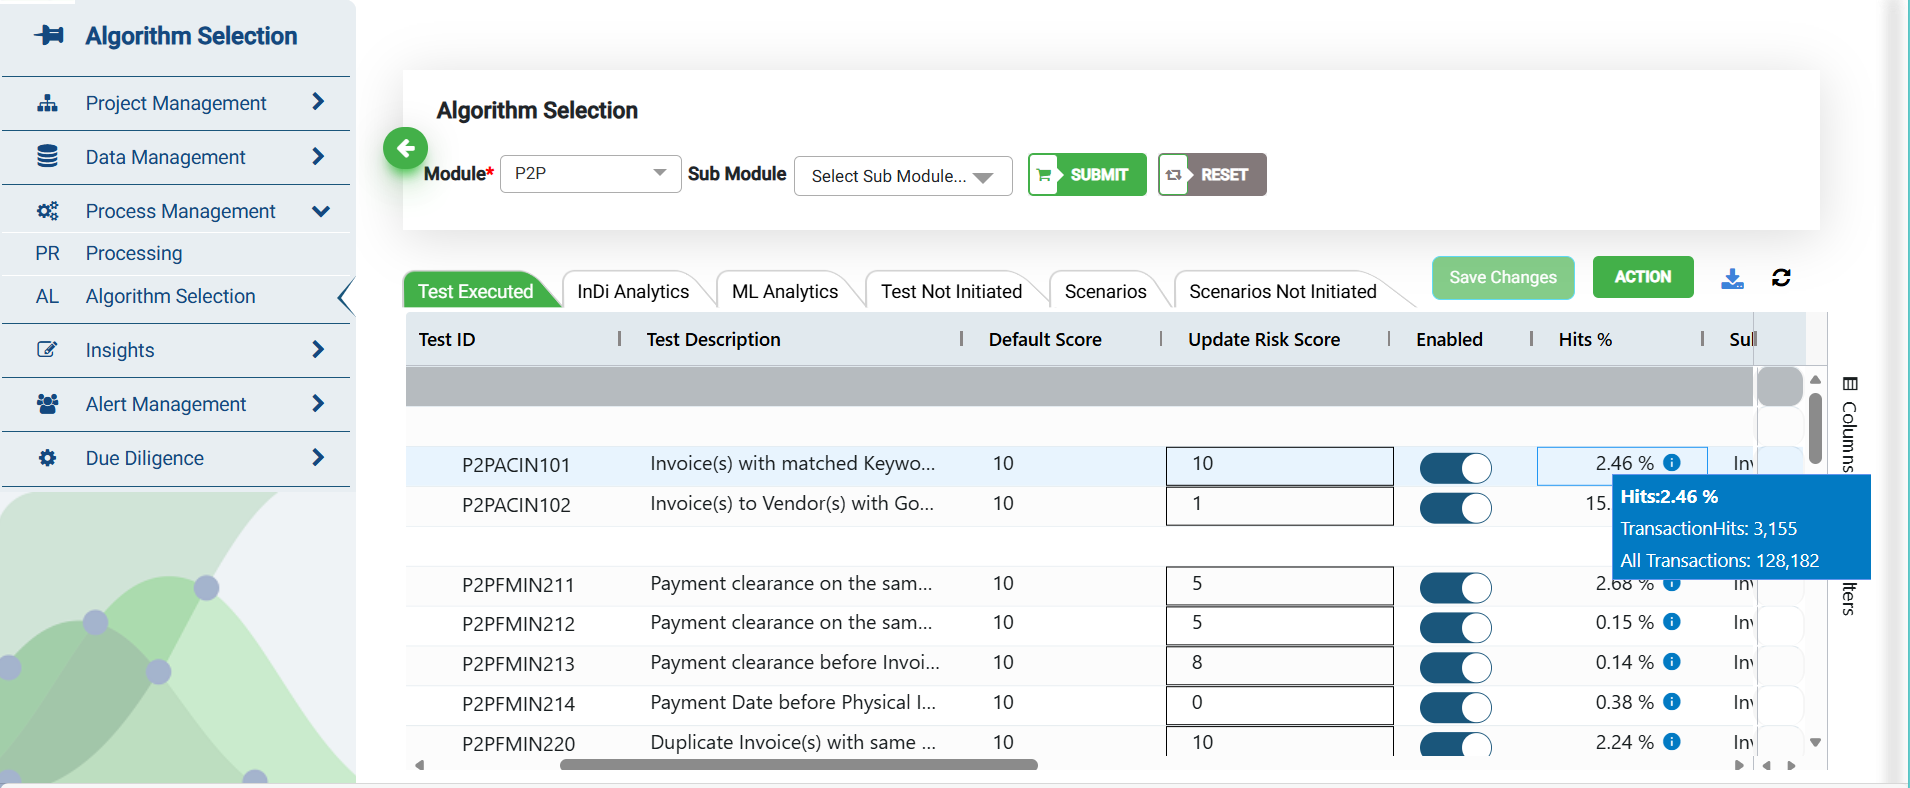
Update Risk Score: Update the weightage of the test by providing the input in the text box.
Enabled: When the toggle is turned on, the test is enabled and when turned off, the test is disabled.
When the test is disabled and re-executed, all the risk scores and failed transactions of the disabled tests are removed.
Hit%: Percentage of risky transactions for a specific test category.
Hover over the “Hit%” number to see the total number of transactions and those that got flagged for failing the system test.
Status: It represents the status of the test execution status.
In progress: It indicates that model execution is in progress. You may use the refresh button to check the change in status.
Completed: It indicates that model execution is completed and the status changes to “View Results”.
Clicking on this option will navigate you to the transaction screen where all the data pertaining to the selected pattern is displayed.
Failed: It indicates that model execution has failed.
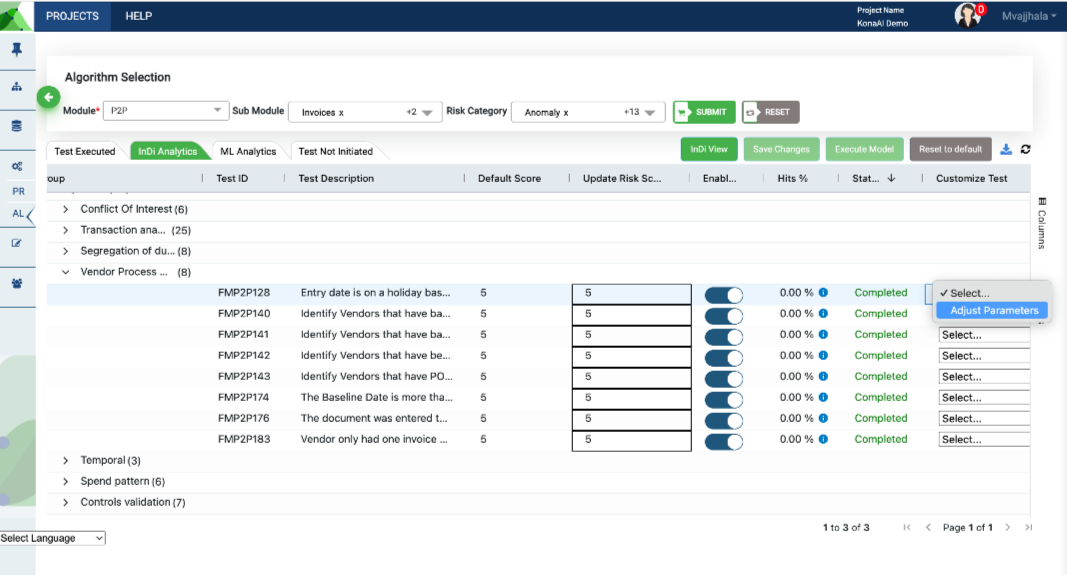
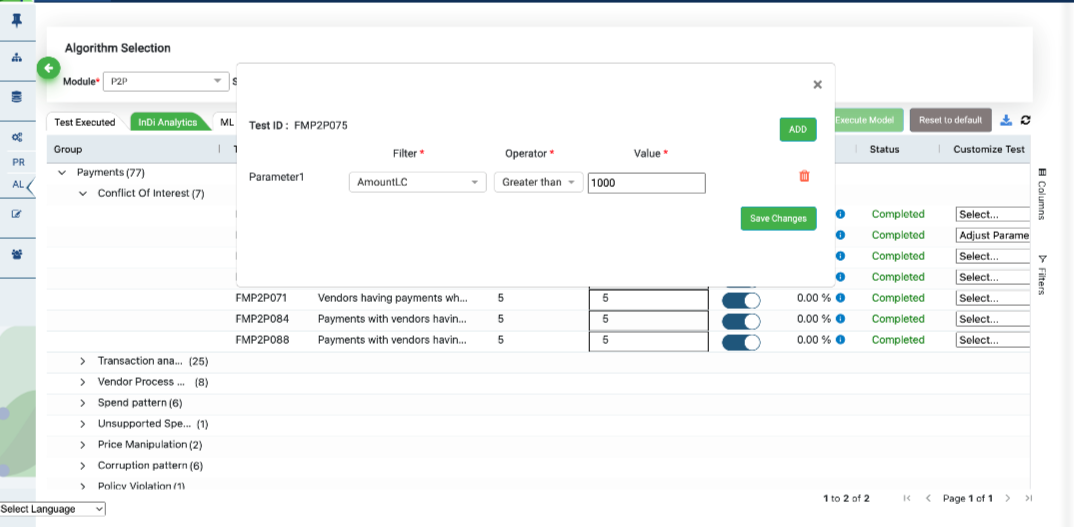
Adjust Parameters
For a much more customized test, you could change the parameters provided to reduce false positives. The customize-test drop-down on the grid, helps you to customize the test by modifying the parameters or changing the test fields or modifying the SQL.
When you click on adjust parameters option, a pop-up appears.
You may add more parameters by clicking on Add button. You could use the Delete icon to remove parameters.
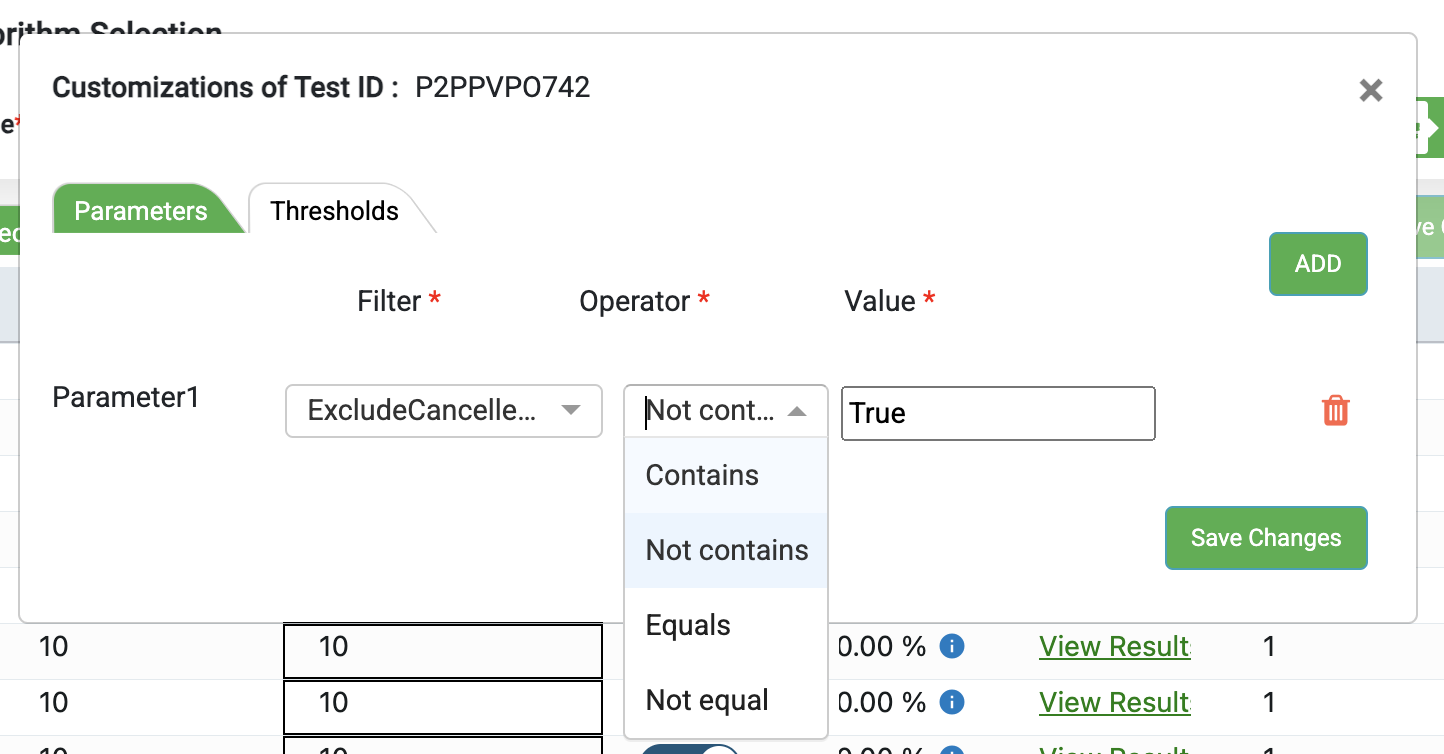
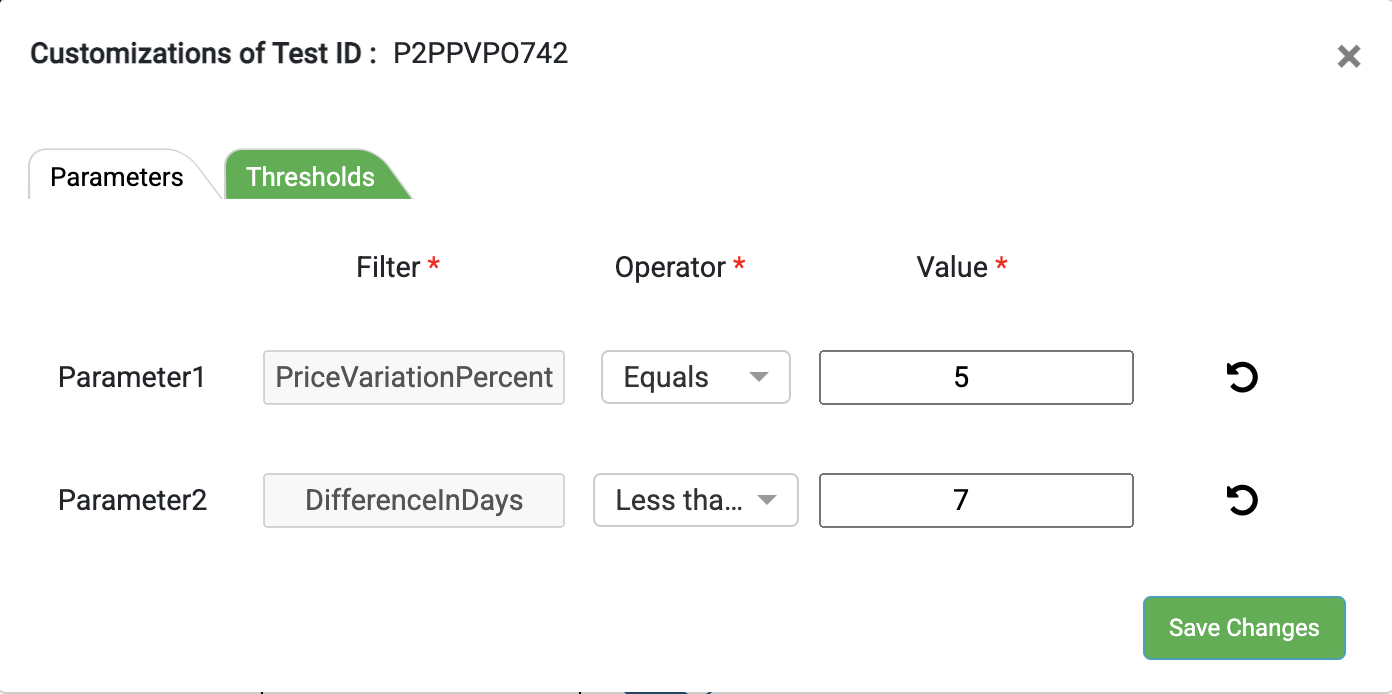
When selecting parameters to adjust, you also have the option to add thresholds to the different parameters.
If the threshold value is updated manually, it will be saved.
If you want to reset it, click on "Reset" to display the default value.
If you enter a value in at least one field and leave the others blank, the data will still be saved.
Prior to executing the model with these parameters, you must train the model, test it and then execute it.
Adjust Parameters - Train Data
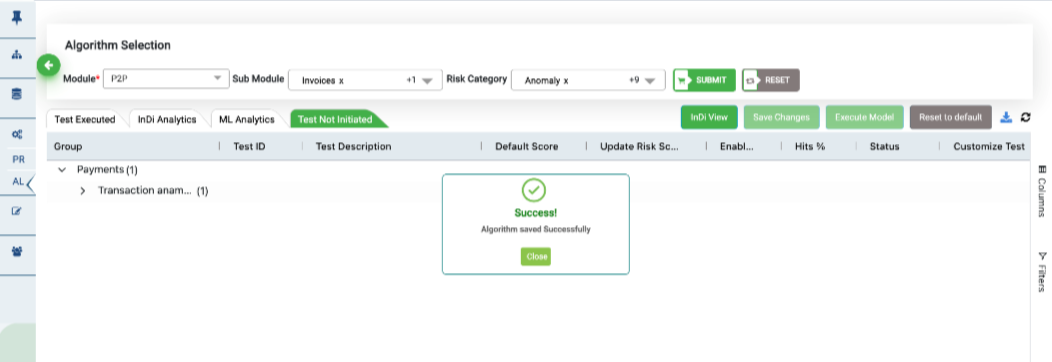
Save the Changes after Training
Adjust Parameters - Test Data
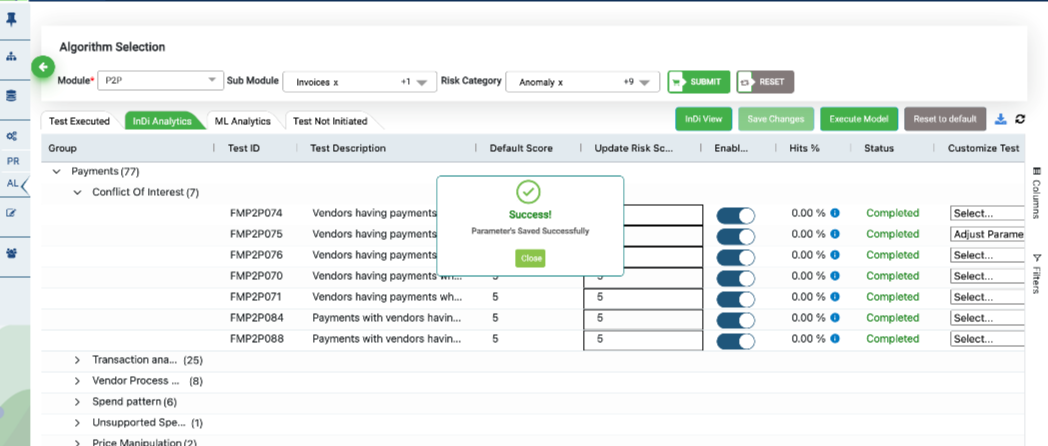
Save the Changes after Adjusting Parameters
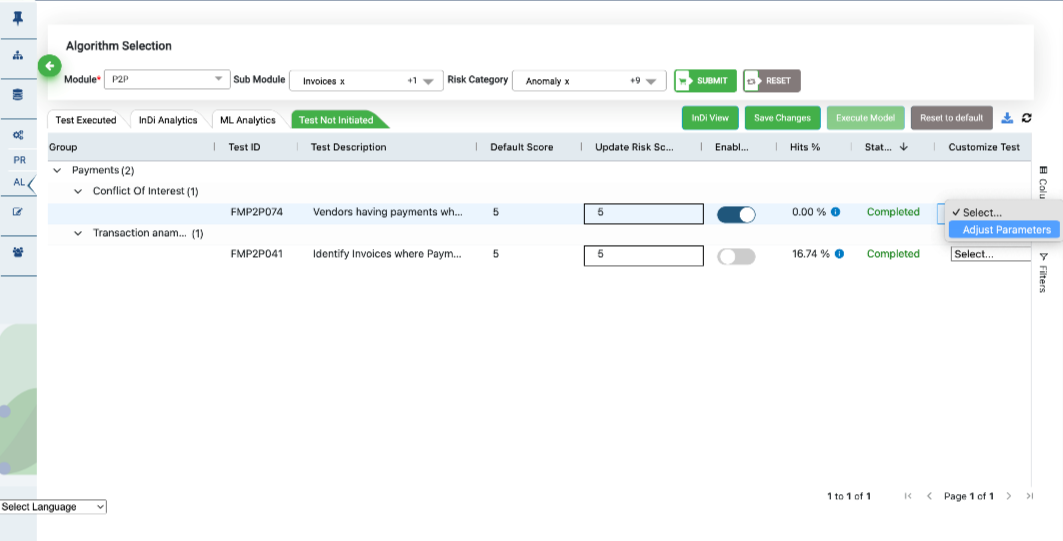
Scenario Tabs
The algorithm selection screen contains two scenario tabs – Scenario and Scenario Not Initiated.
.png)
These scenarios tab shows a list of scenarios that have been applied on the data sets in the project. The column options indicate the scenario status to show whether the execution was successful or not. Scenarios that have been triggered with alerts to users get populated in the Scenarios tab while all other go into the Scenario Not Initiated tab.
.png)
To view or edit any individual scenario, filter the column by “Status“ and click on View Results. User will be navigated to the scenario edit page. Any changes made to the scenario on this page gets applied to the entire project.
.png)
Execute Model
On the work area click on Save Changes then click on Execute Model to initiate the process. You may click on the Refresh button to monitor the progress. The processing time is displayed on your screen when any test is executed. All the analytics displayed in the grid could be downloaded as .csv or .xlsx using the Download button.

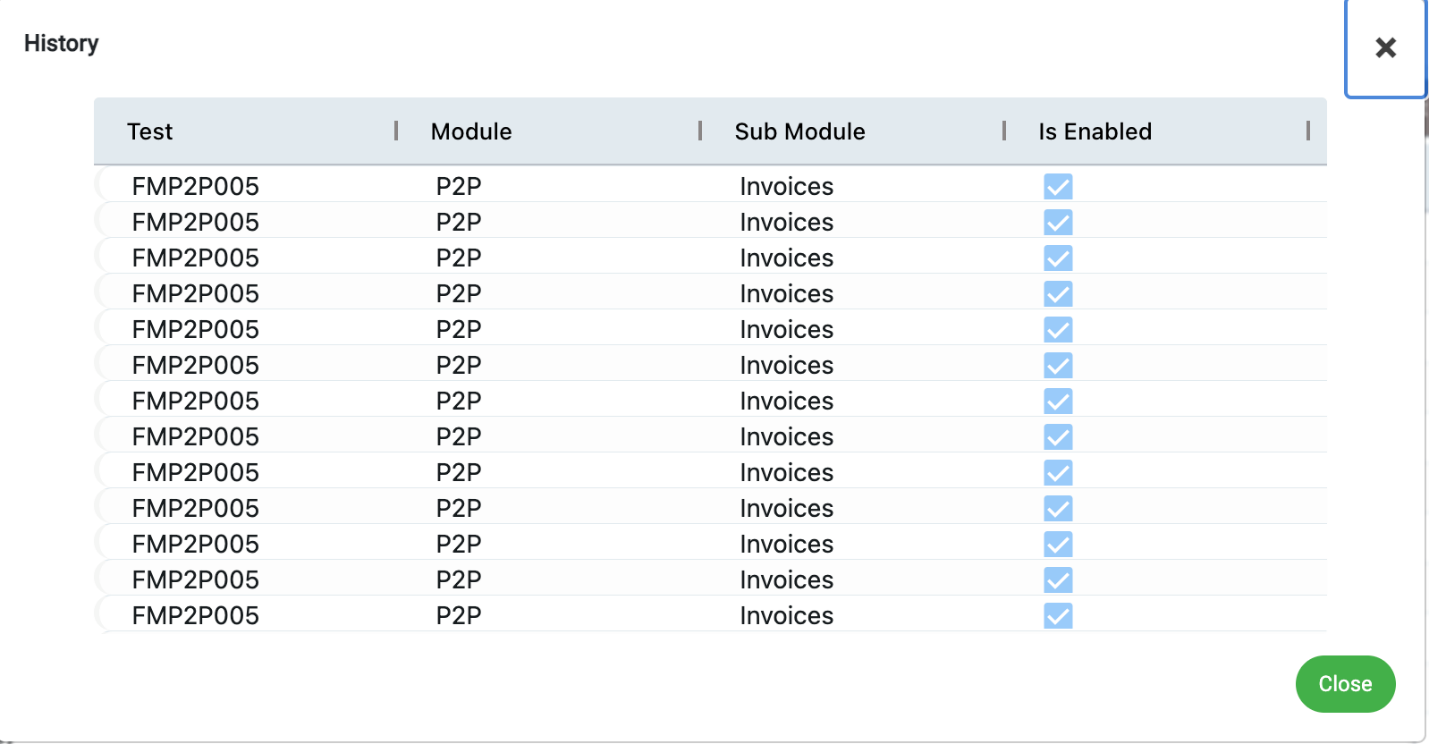
This screen also lets you view the previous actions performed on the model. Next to each group name is a corresponding history button under the “Action” column. Selecting this button will cause a pop-up to appear on your screen with a table containing the previous modified values.