The Transactions View in the konaAI platform allows you to gain insights into all transactions with flagged results. By accessing this view, you can filter and display only transactions that have generated flagged issues in one or more tests, ensuring a focused analysis of critical areas.
The Transactions View streamlines risk assessment and management, facilitating a proactive approach in identifying potential fraudulent activities or compliance violations efficiently. You can avail the benefits of the following features to sort through your data.
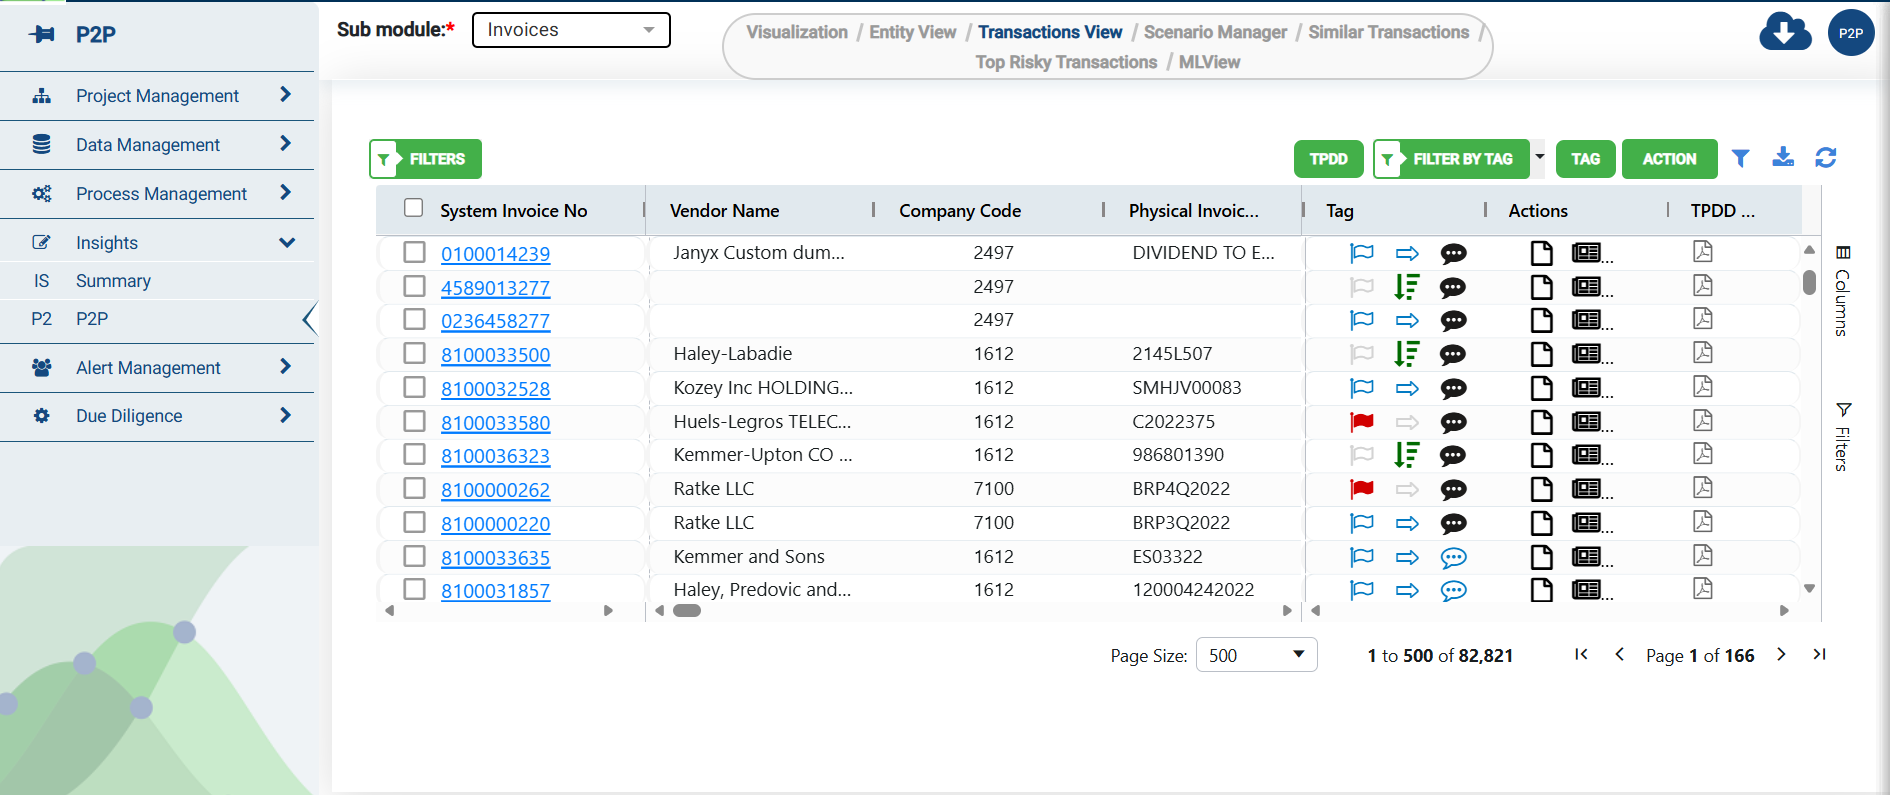
Transactions can be sorted based on criteria such as Risk Score, the number of tests failed, or other relevant features, enabling you to prioritize high-risk transactions for further investigation. With the ability to click on individual transactions, you can explore in-depth details and review transaction dates, amounts, descriptions, and associated flagged issues or risk indicators.
Column Filter
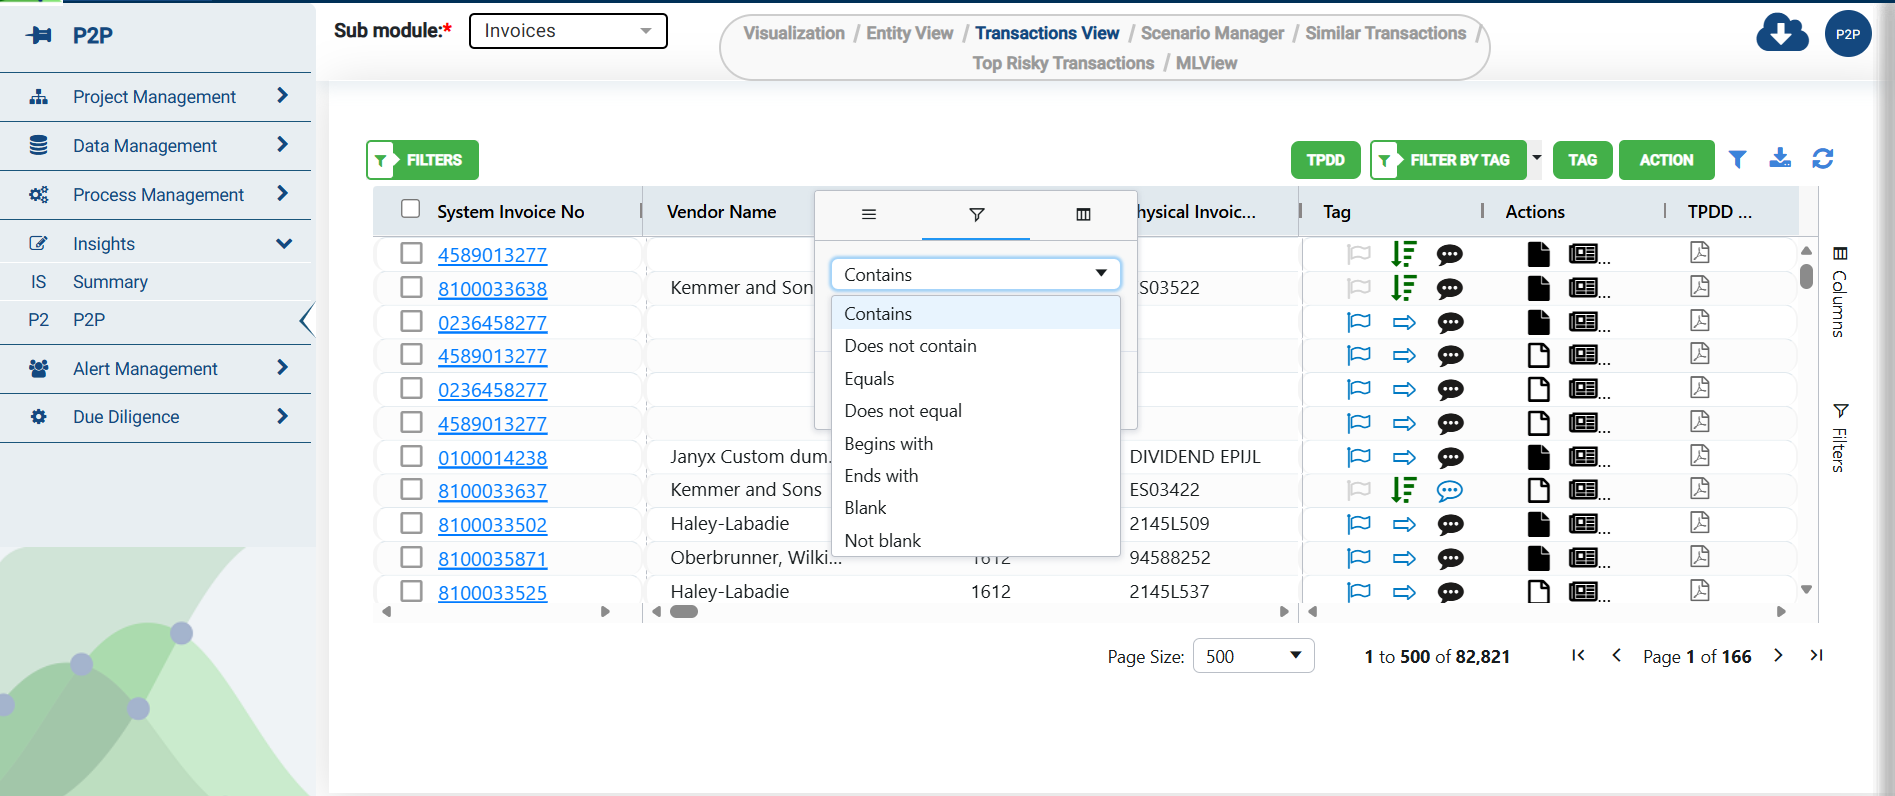
You can filter the columns to view specific data. Hover the mouse next to the column name to see the column menu ![]() , click on the menu icon to view the options.
, click on the menu icon to view the options.
The filter option is the second tab in the menu and lets you customize the data that you wish to see. Select the filter option(s) that you wish to use and click on the “Apply” button to view the customized table.
.png)
Alternatively, users can drag and drop columns to rearrange column orders, data sorting, and filters. The changes made are automatically saved to the project. However, changes made by a user are not applied at the project level for all users. This feature is user specific and only impacts the experience at the individual level.
You can use the “Reset” button to revert to the default column setting.
Note: Changes made to this screen will also be reflected in the Alert Management and other Insights screens.
Table Filter
![]()
The updated filter button next to the green “Action" button now lets you select additional filter options for the table. When this option is selected, you will be able to view additional filter options on your screen which will enable you to dive deeper into the data.
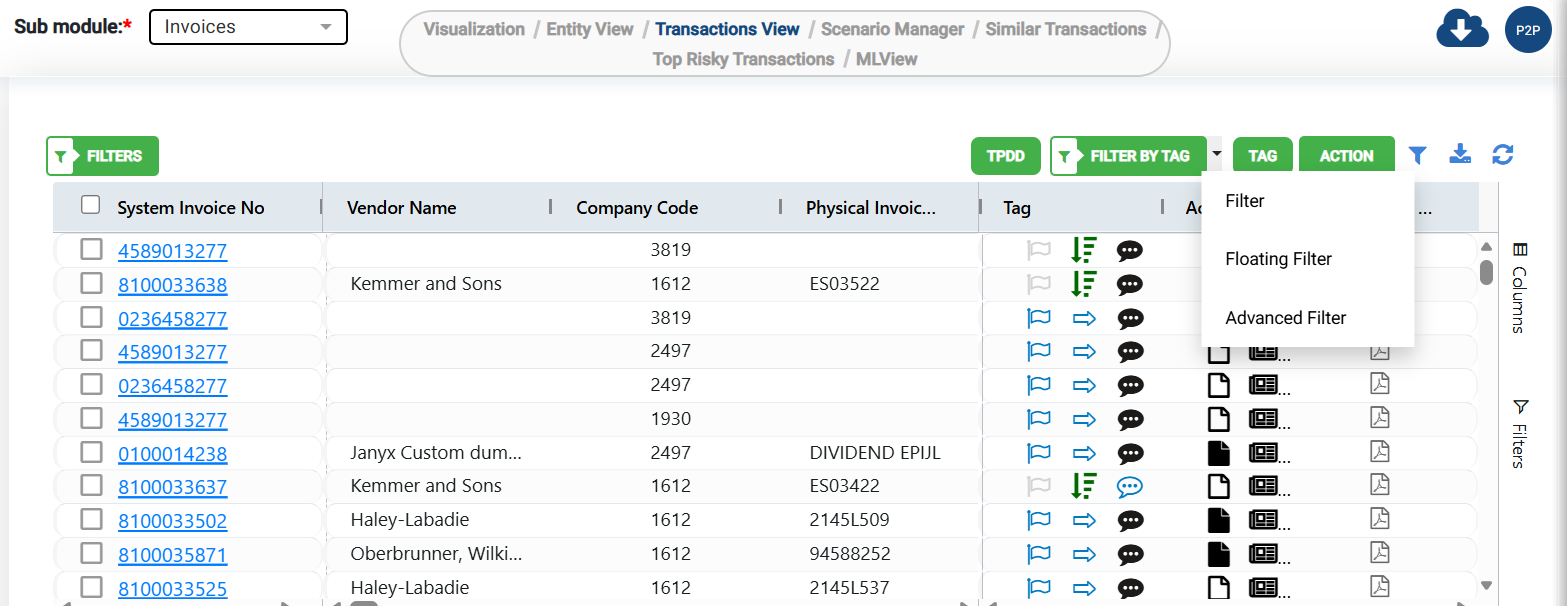
Floating Filter
Enables users to add column id or vendor id to the search bar
Users can narrow their search to a specific group of invoices or orders etc.
Advanced Filter
Select the “Advanced filter” option to manually input filters.
Click on the space bar provided on top of the grid to access a list of filter prompts.
Ensure that all filter names and values are within “” for the filter to be recognized by the application.
Once completed, click on Apply.
Only when the apply button is selected will the action be performed by the application.
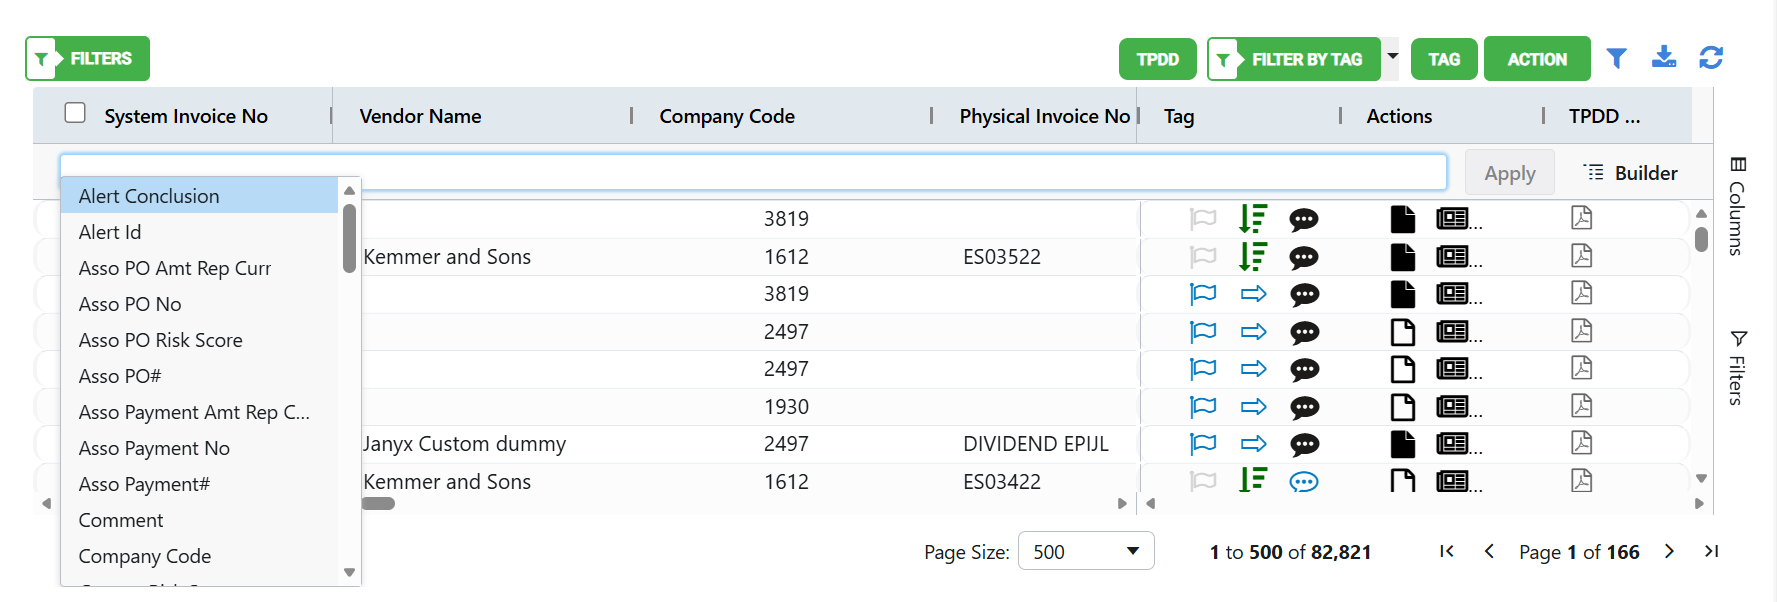
The “Builder” button next to the “Apply” button provides a pathway of the filter options you have added to your data set. You may also modify the filter options here.
![]()
Grid Refresh
The Grid Refresh button removes all the filters applied to the table. The entire grid is refreshed to display the default data view. Alternatively, you can always use the “Reset” button under column filter to revert to the default setting.
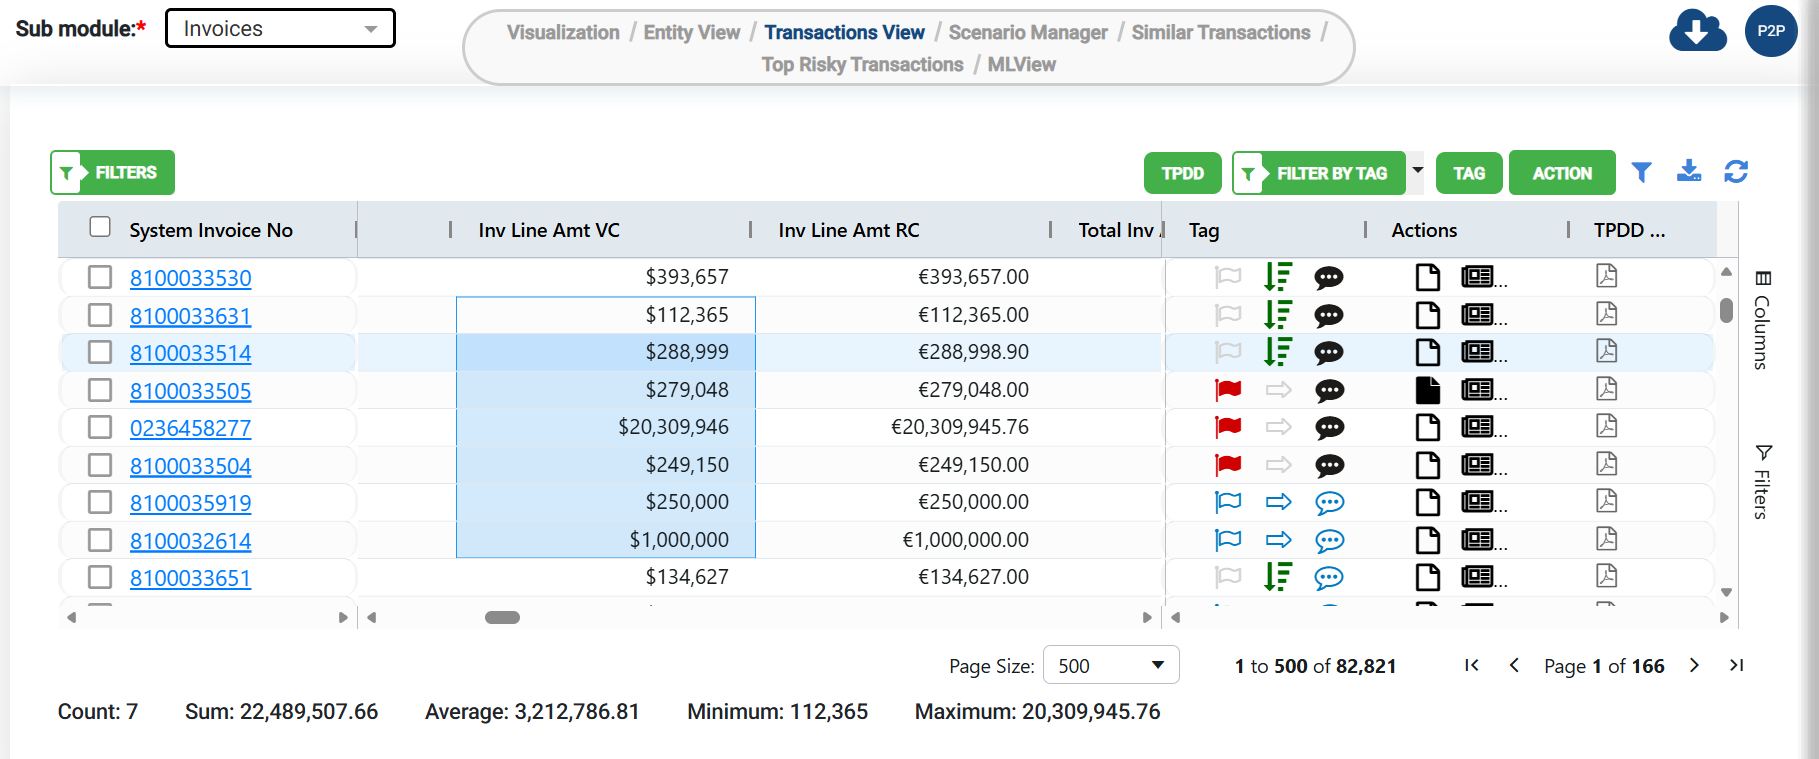
Summary of Numerical Values
Navigate to any column containing only numerical data.
Select all the rows you wish to obtain a summary for.
Data summary is provided at the bottom left corner of the grid.
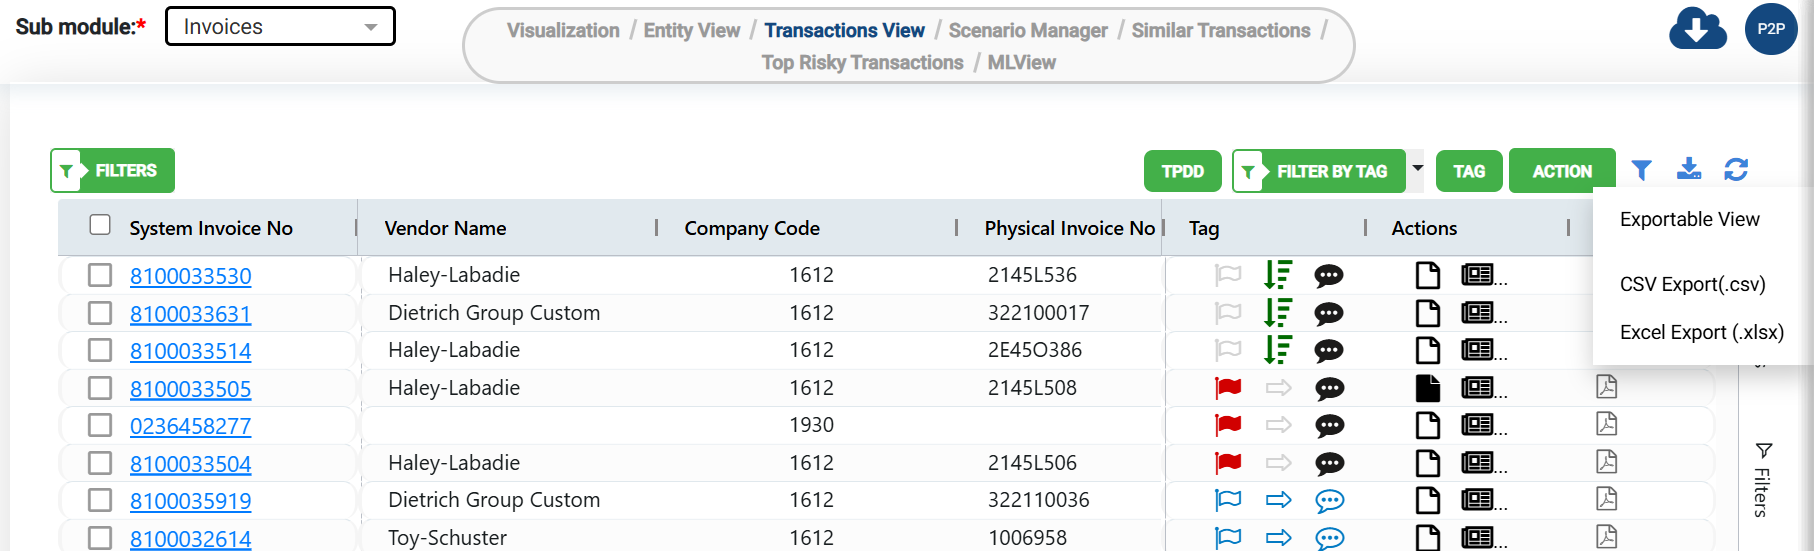
Download Transactions
The download option l located in the menu above the transactions grid lets you download the entire transaction table or select specific transactions to download.
When you select a download option, a pop-up will appear on your screen prompting you to edit the file name.
By default, the file is named by the date on which the download is occurring.
![]()
Click on the green “save” button to initiate the download.
![]()
You will receive an email notifying you when the download is complete.
![]()
Alternatively, you may view the download status under “My Downloads” under Project Management.
The file status will change from InProgress to Completed, once the download has been completed and available for access.
![]()
Note: If you download only specific transactions, you will be able to access the downloaded file immediately. You will only receive an email notification when you download large data sets.
Grid Configuration
The Action button displayed on you work area has a grid configuration option which lets users modify the columns and how the data is displayed on their screen.
.png)
Clicking on the grid configuration option, opens a pop-up box on your screen with a list of all the columns.
Use the checkboxes under the display column to modify what data is displayed and change the column alignments.
User can also select which currency format they wish to see.
This feature can only be applied to the fields that have been enabled on your screen.
Disabled options cannot be modified.
.png)
Note: This functionality can be managed across all Insight’s screens. Once changed by a user, the modifications are reflected across all Insight windows for all users.